
HDD & CDD Data
U.S. natural gas heating, population, and oil weighted degree day data setsMost data sets are available from either 1971 or 1981 to present, and forecast data is available out to 15 days as well as nine months (based on our seasonal forecasts). We utilize hundreds of data points across the country in our calculation, and weight the population of the entire country into our calculations.
You can view a full listing of all the data files available on our subscriber data page by clicking here. Note that you will not be able to access any of the data files without a subscription.
Click here to read a guide on how we calculate our population and gas weighted degree day data.
Summary of Available Degree Day Data
- Historical and forecast U.S. population weighted degree days
- Historical and forecast U.S. gas weighted degree days
- Historical and forecast U.S. heating oil weighted degree days
- Historical and forecast degree days by census region
- Historical and forecast degree days by EIA gas region
- Historical and forecast degree days by power region
- All degree day files are available in a daily and monthly format
- Historical degree day weighted data available back to either 1971 or 1981 depending on the data set
- Forecast degree day weighted data is available out to 9 months
- Data files are updated twice per day
- Data files are available by website and ftp download
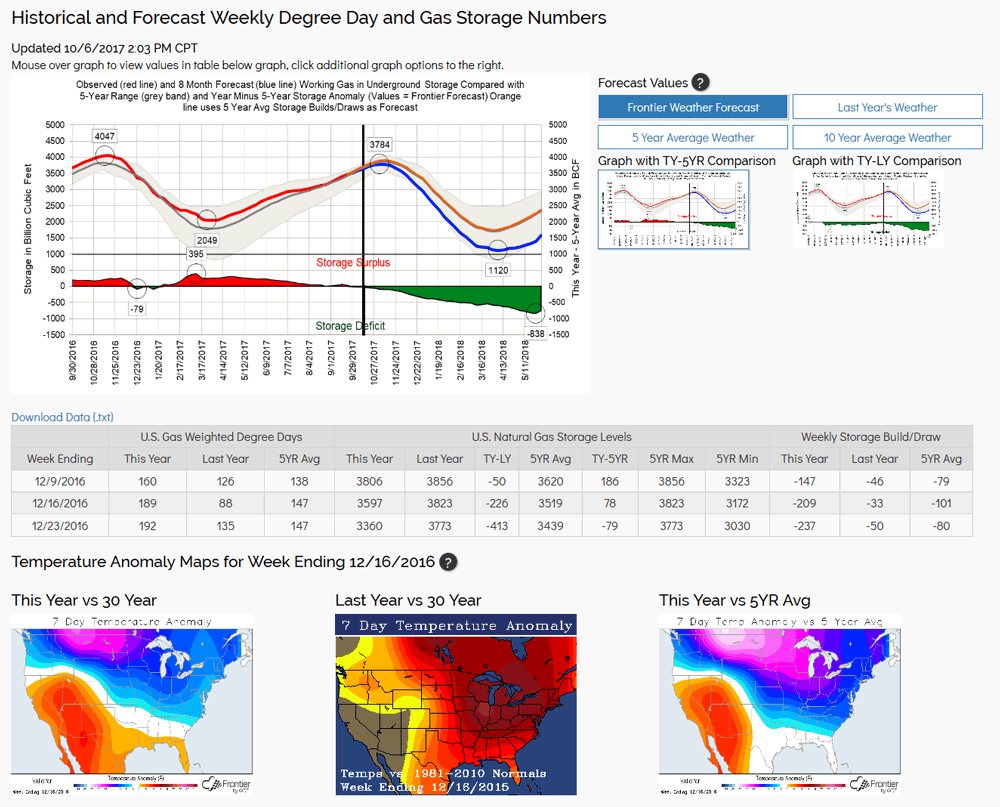
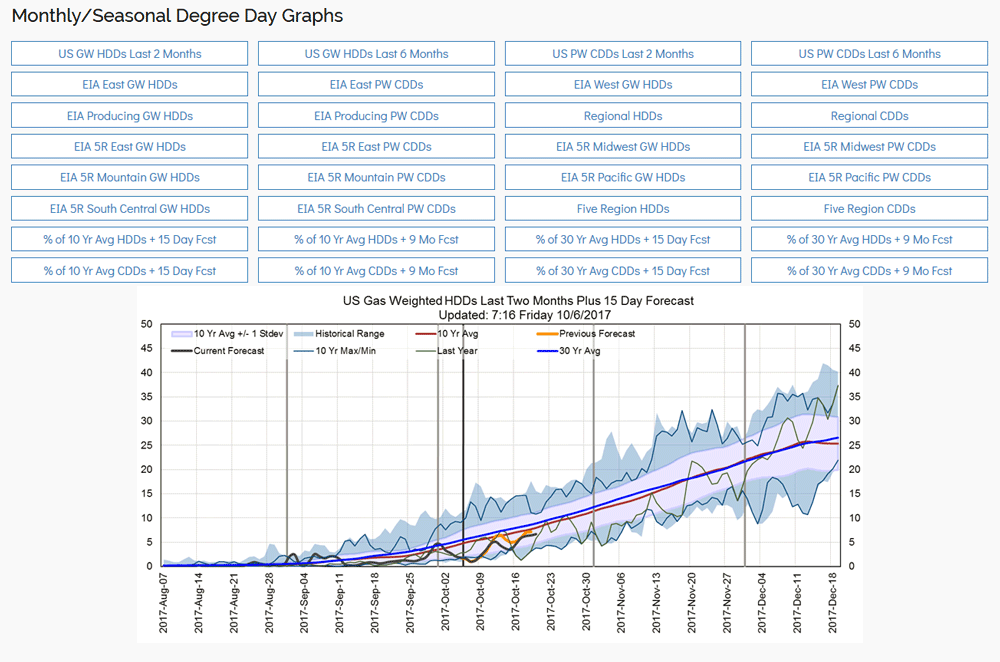
Long-Range Degree Day/Storage Projections & Other Graphs
Our seasonal forecast data is also available in a nine month daily degree day format to allow for calculating long-range natural gas storage totals and changes. We have a website page set up to allow viewing this data graphically that is updated daily with our latest forecast data. While we are not attempting to directly forecast week to week weather out to nine months, the long-range daily data projections are nonetheless useful for projecting long-term changes to natural gas storage levels. The website page allows you to view not only what the projected storage levels for our seasonal forecast, but to plug in the previous year's data or the five or ten year averages and then calculate the resulting storage projections. We also have numerous additional degree day graphics available. A couple sample graphics are shown below.